


What issues concerning data were you working on when you came across the IO Technologies platform?
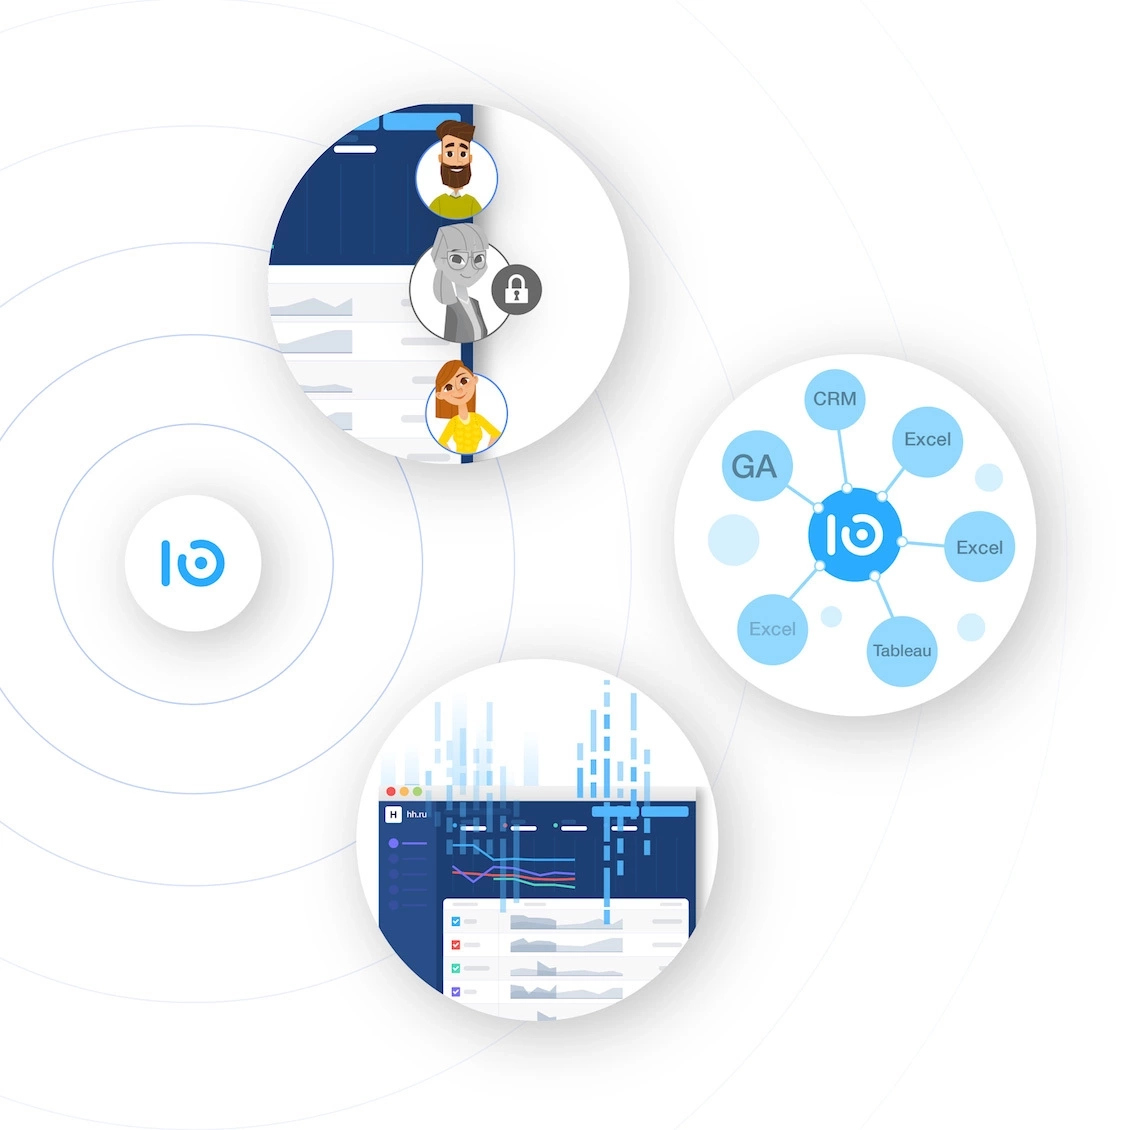
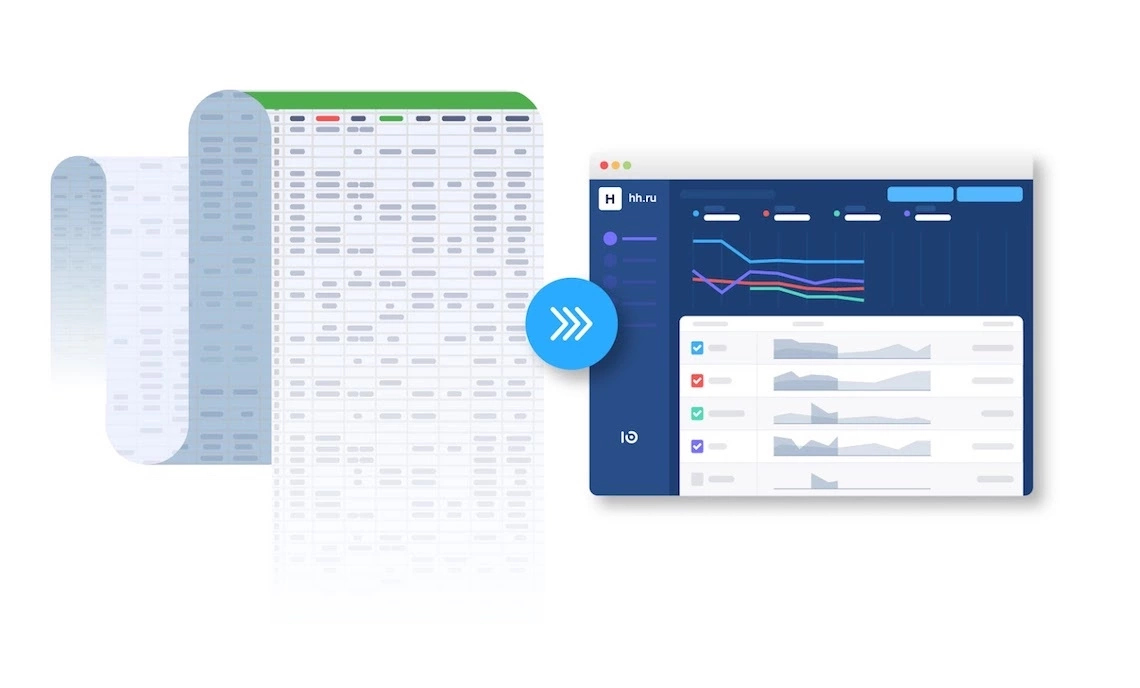
Before we started our cooperation with you, we had (and still have) several data sources: various web analytics systems; Google Analytics, SimilarWeb, App Annie and others, as well as internal reports and Tableau. We also had an enormous number of our "beloved" Excel files with all sorts of data. We decided to combine all these systems into a single one.
IO analytics was necessary for automating data collection, presenting it in a convenient format and, most importantly, making this format public in fact that sending Excel files to each other is not the most comfortable thing.
We had to restrict individual users from accessing certain reports. It was vital for us to have the ability to provide the access to the users who required it rather than sharing a large report with everyone.
Apart from that, combining everything into one solution gave us an opportunity to bring together different systems in one place.
How did you choose the solution?
We were not deliberately looking for a specific dashboard system. It happened some time ago that IO and I first met when we were looking for an alternative for Google Analytics. At that point of time, Google Analytics sent us a warning about disabling our usage due to the large amount of data on free version.
We initially communicated with you about 3-4 years ago. IO was more like an analytics system rather a set of dashboards. So, mid last year, we met with IO team again and had a possibility to see how the product had evolved. We decided to conduct a demo and realized that it was an interesting story that could be realized.
What metrics did you use after introducing IO? Why didn’t you use them earlier?
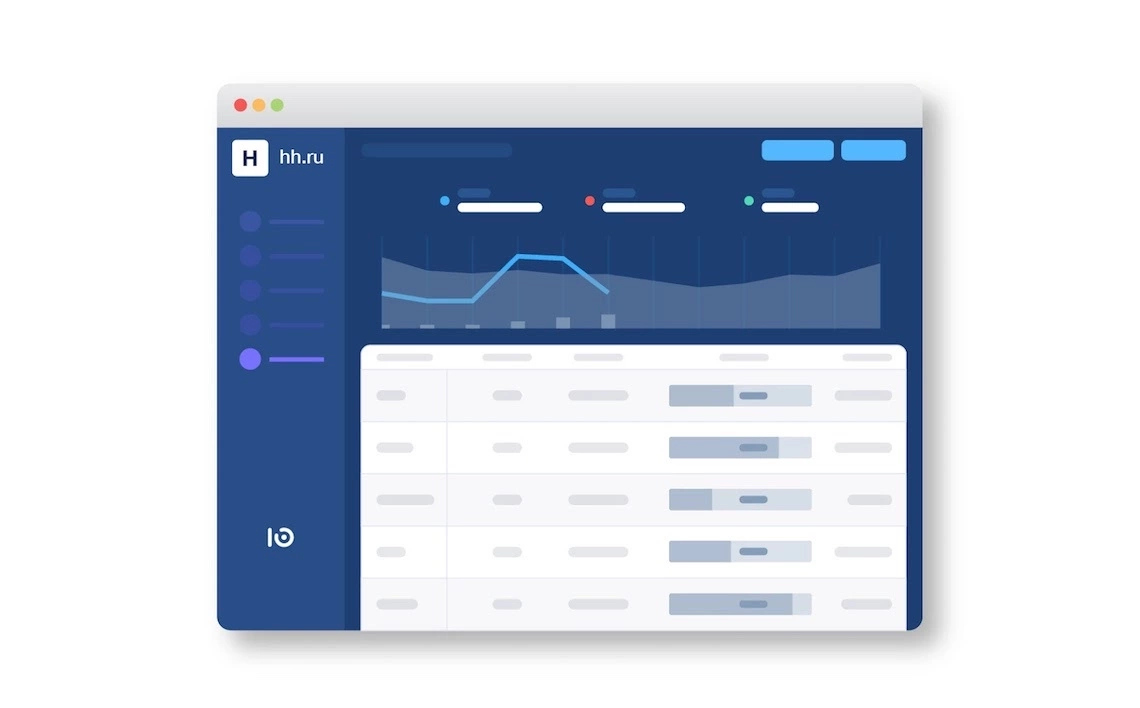
At this stage, we use almost all the reports that we used before, the only difference is that they are automated now. They are simply brought together with each other and visually, that provides better usability.
Still, we have several non-standard solutions, which we did not have earlier. One of them - session plan forecast based on the mathematical model. It automatically hooks holidays and weekends by current month and use it in model. Actually, this is an illustrative story when it is possible to see in real-time whether the plan is met or not. The rest is primarily data visualization and adding more convenient elements.
What discoveries related to data have you made while obtaining new reports?
Our productivity has changed in terms of time spent on compiling and adapting reports. The time spent on helping colleagues obtain certain data has also significantly decreased.
First and foremost, we draw attention to the mass use of reports. We have a fairly large number of staff who are tied to data analytics: only 50 marketing specialists, including regional ones. So, the data used universally should be displayed first. Things that require close attention go next.
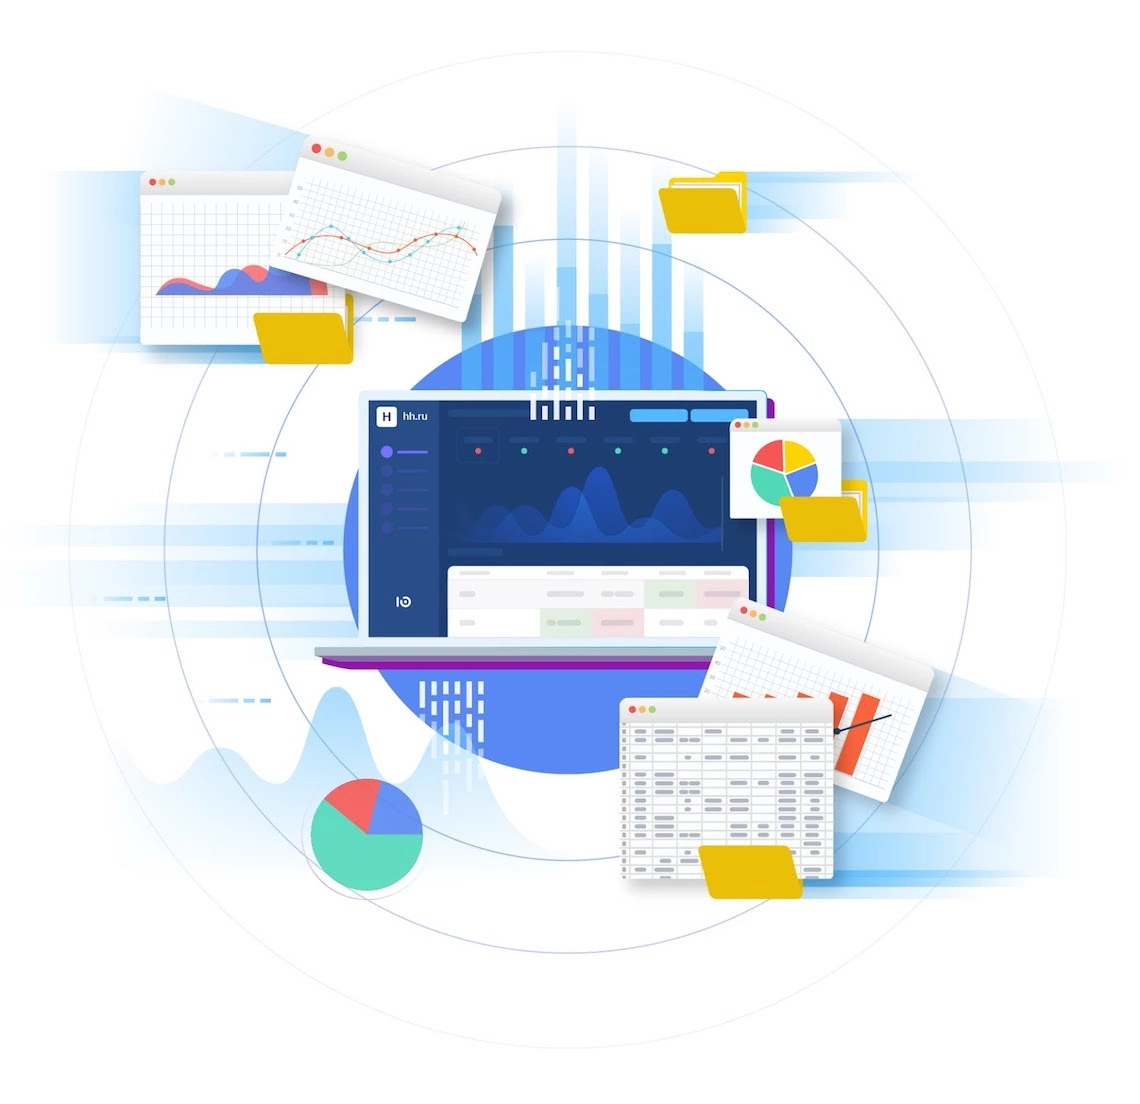
I will give an example of our last report, which we have almost finished. This is a report on mobile analytics. We merged 4 systems in one place - 2 web analytics systems, an automated system on counterparty spends and an Excel file with the "rules", which can be changed manually. So, looking at the data collected in one place is always more lucrative, as we can see the correlation and changes and don’t need to bounce between different reports and try to compare all the data in our heads.
There is also the third case, which we are discussing now. This is associated with email analytics, which we want to develop in a separate plan.
Every time, after the product launch, we collect feedback from its users, we discover some new stories worth adding. Some things often "pop up" only after we start using the system. Therefore, new metrics, which we would like to track additionally, are emerging.
Maxim, can you describe the most vivid example of a report developed with the IO team?
There are two such reports, which I would like to outline. The first one is an outstanding case with the LiveInternet report. We used your expertise in site crawling, collecting custom statistics and creating visual design. The second one is the mobile apps case, which has been already mentioned. There, we collect a large number of various data in a beautiful, compact and readable view.
How smooth is the process of involving the team into working with the IO platform and dashboards?
Generally, everything went smoothly. We prepared a minor tutorial so that people would understand where to click and what to select. There were several minor issues and difficulties. For example, there was a misunderstanding with the selection of dates in the first reports, but this is a matter of habit. Now, we are bringing this point closer to standard analytics systems. I think these issues will be completely resolved in the nearest future.
People did not ask many questions. There were some small misinterpretations and bugs that were quickly fixed, but in general, everything was seamless.
What results have you achieved since you started your cooperation with IO? How often do you conduct checkpoints?
We do not conduct such checkpoints, as we are working on the integration of new data and visualization now. However, I would like to highlight some pleasant moments of our cooperation:
- High-quality communication with IO representatives;
- Convenient visualization;
- Very fast and responsive system.
Try IO on Your Own Data Now!